Benchmarking Dashboards
Benchmarking dashboards allow you to compare one segment of your data against all of the data. Benchmarking can help identify the strengths and weaknesses of a segment.
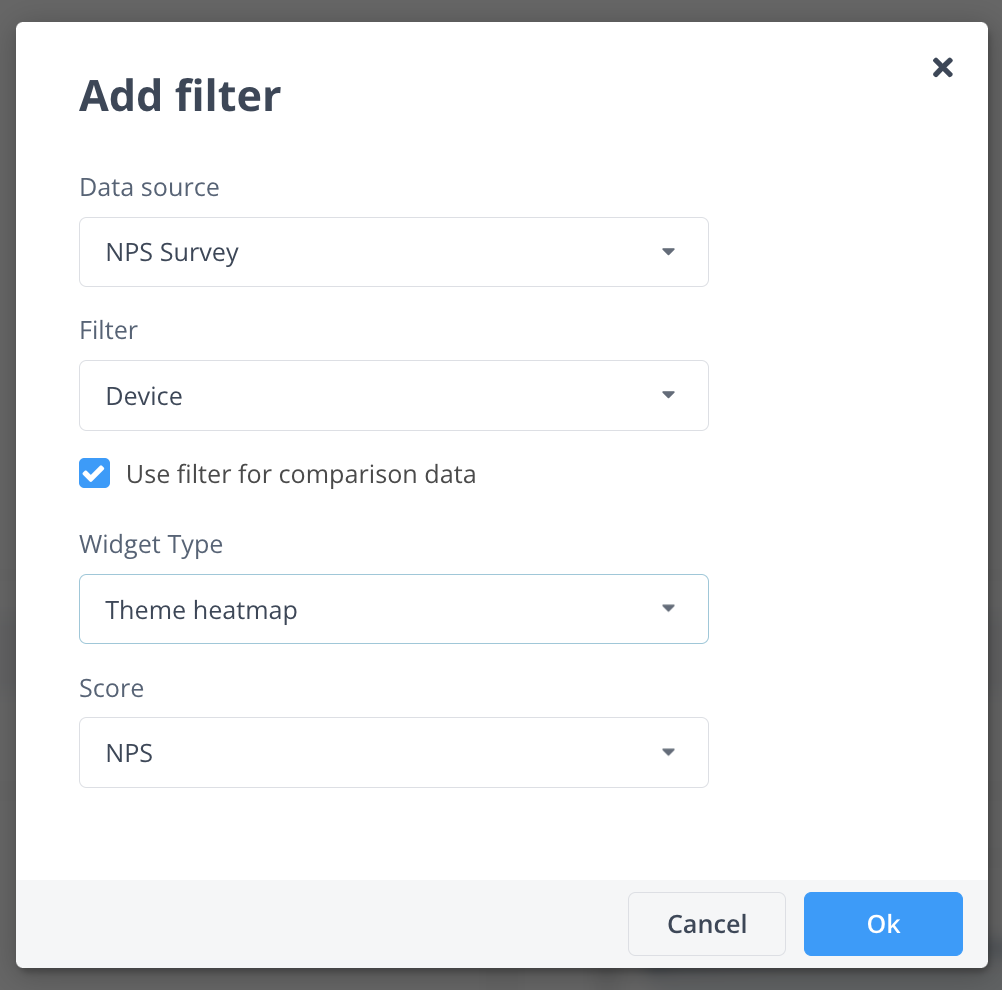
At the top of a benchmarking dashboard will be the filter allowing you to select the segment. It may be a simple filter or show additional information about each segment based on the metric selected.
To enable filter comparison, simply tick the box next to 'Use filter for comparison data' when adding a new filter.


There are 4 different widget types you can select from to enable a segment comparison
Dropdown
Allows you to compare one segment of your data against all of the data.


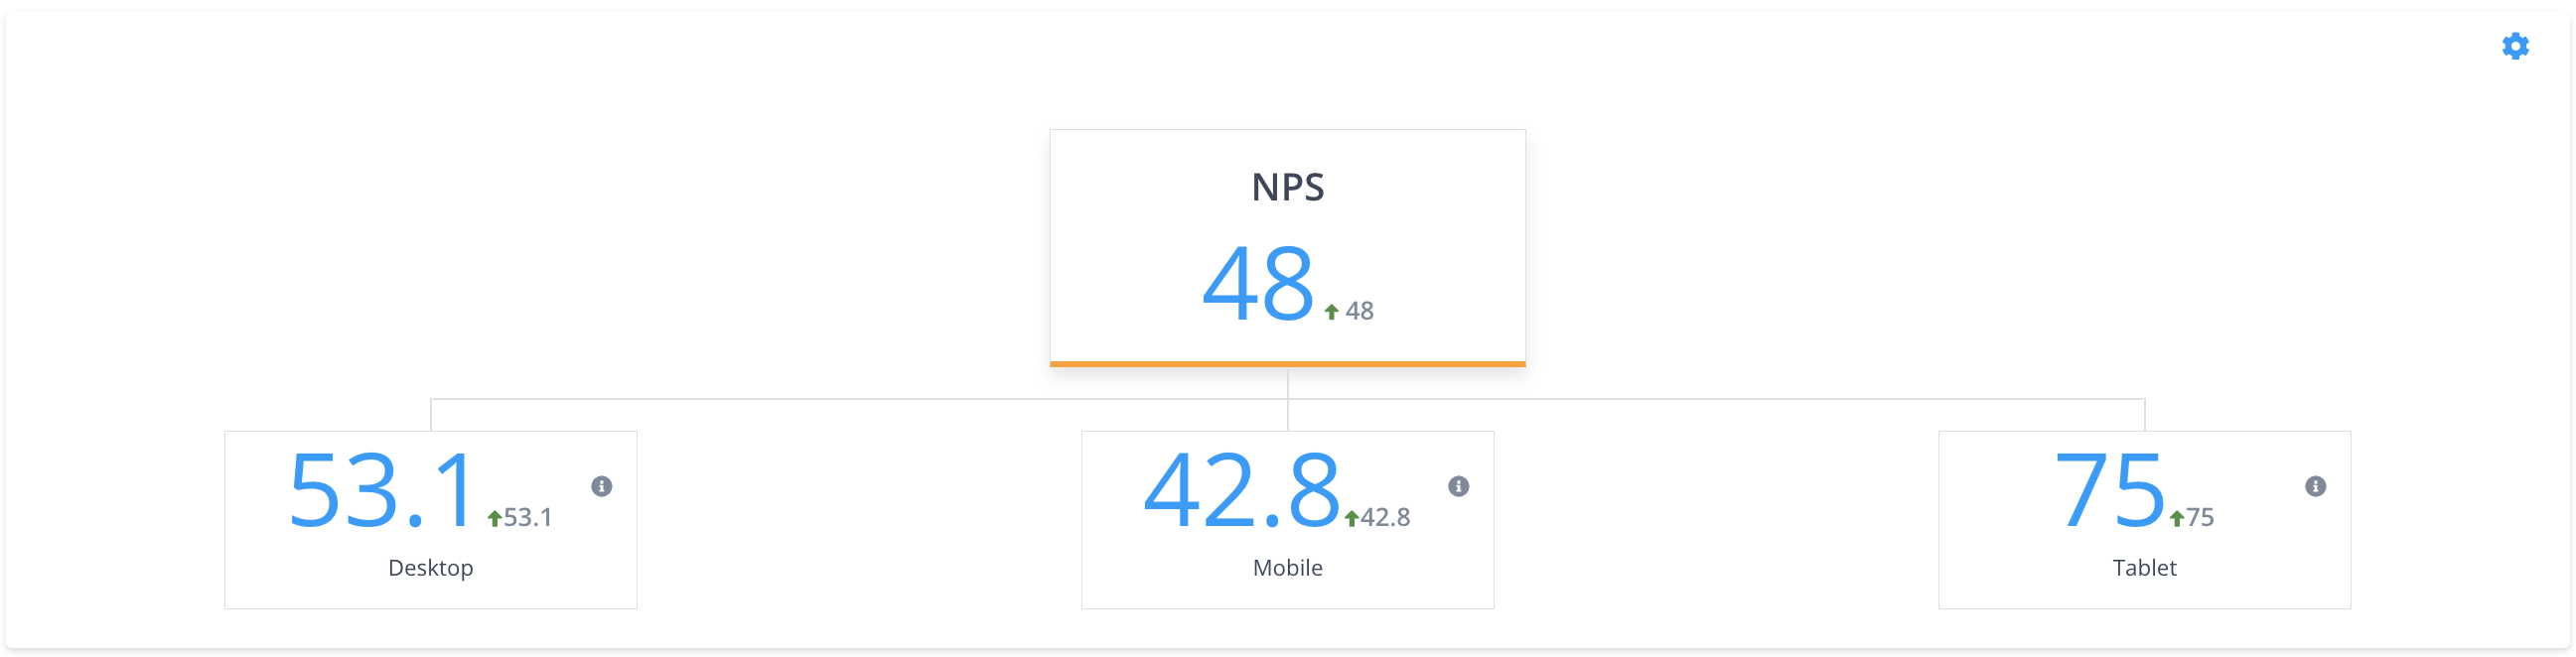
Theme Heatmap
The Heatmap widget will allow you to compare all base themes and their impact on a specific metric for each field of a selected filter.
To enable select heatmap from dropdown and choose the score metric of your choice.

Benchmark table
This widget will show the average score and additional information about each segment based on the metric selected e.g. NPS score with volume and sentiment comparison.


Score breakdown
This widget will allow you to see the average score across all fields within a filter and the average score in total.

Was this article helpful?
Your feedback helps us improve our documentation.