
Score Change
The Score change tool requires dates and scores in your data to display properly ie. NPS or CSAT
The Score Change analysis tool helps you understand what has contributed to the changes in your score over time. It is different than the impact view because it shows change across time periods, instead of looking at each individually.
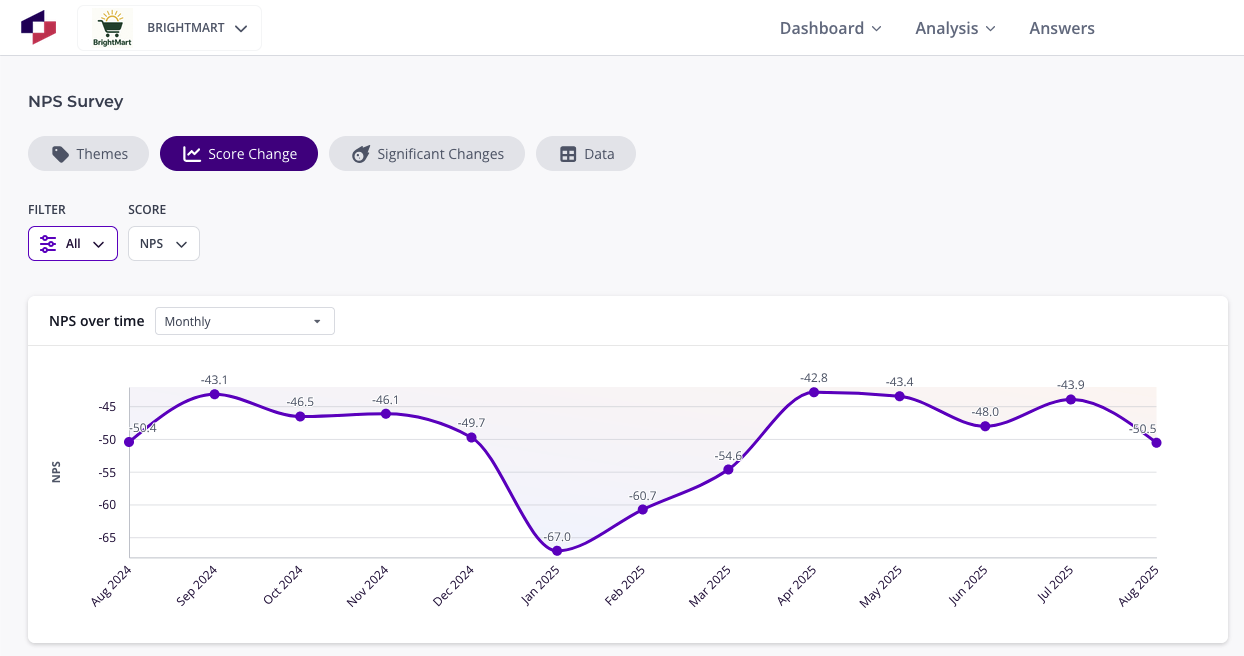
Score over time
- Click on a time period to see its score compared to the previous time period. Hovering over it will show the exact score.
- You can select two exact time periods to compare using the date selector in the bottom left.
- Change the time period to weeks, months, quarters, biannually or 90 days rolling using the selector on the top left.
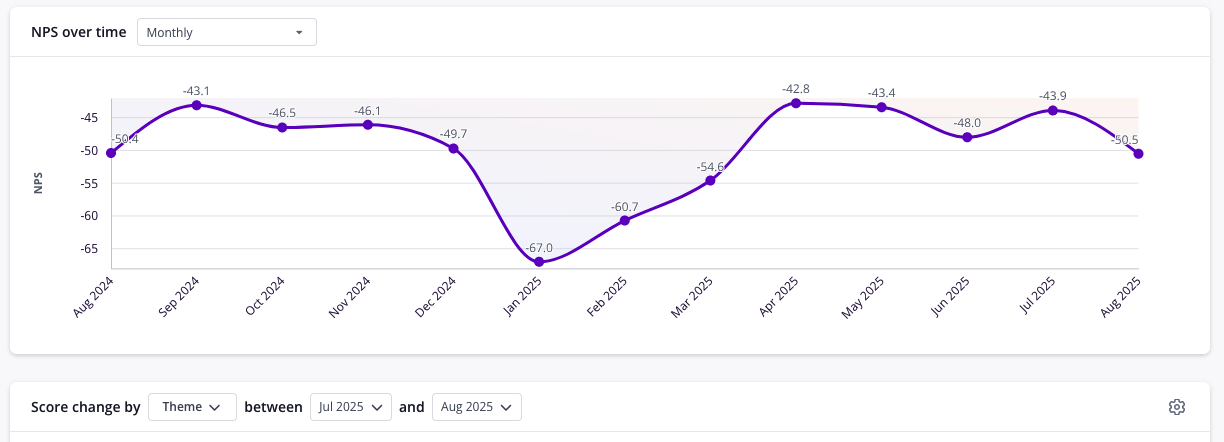
Themes that caused the change in score
- You will see a summary of the two time periods and what people say in them, so you can quickly understand what has contributed to the changes in your score over time.
- The graph will show what themes caused an increase (green) or a decrease (red) in the score and by how much.
- The total change of all the themes will add up to the total difference in score.
- Click on any base theme to see its sub-themes, and click on any theme to see its example comments.
- Hovering over a theme will show details about its volume and score in both time periods.
- A positive theme can cause a negative change by fewer people mentioning it, or the score of people mentioning it becoming less positive.
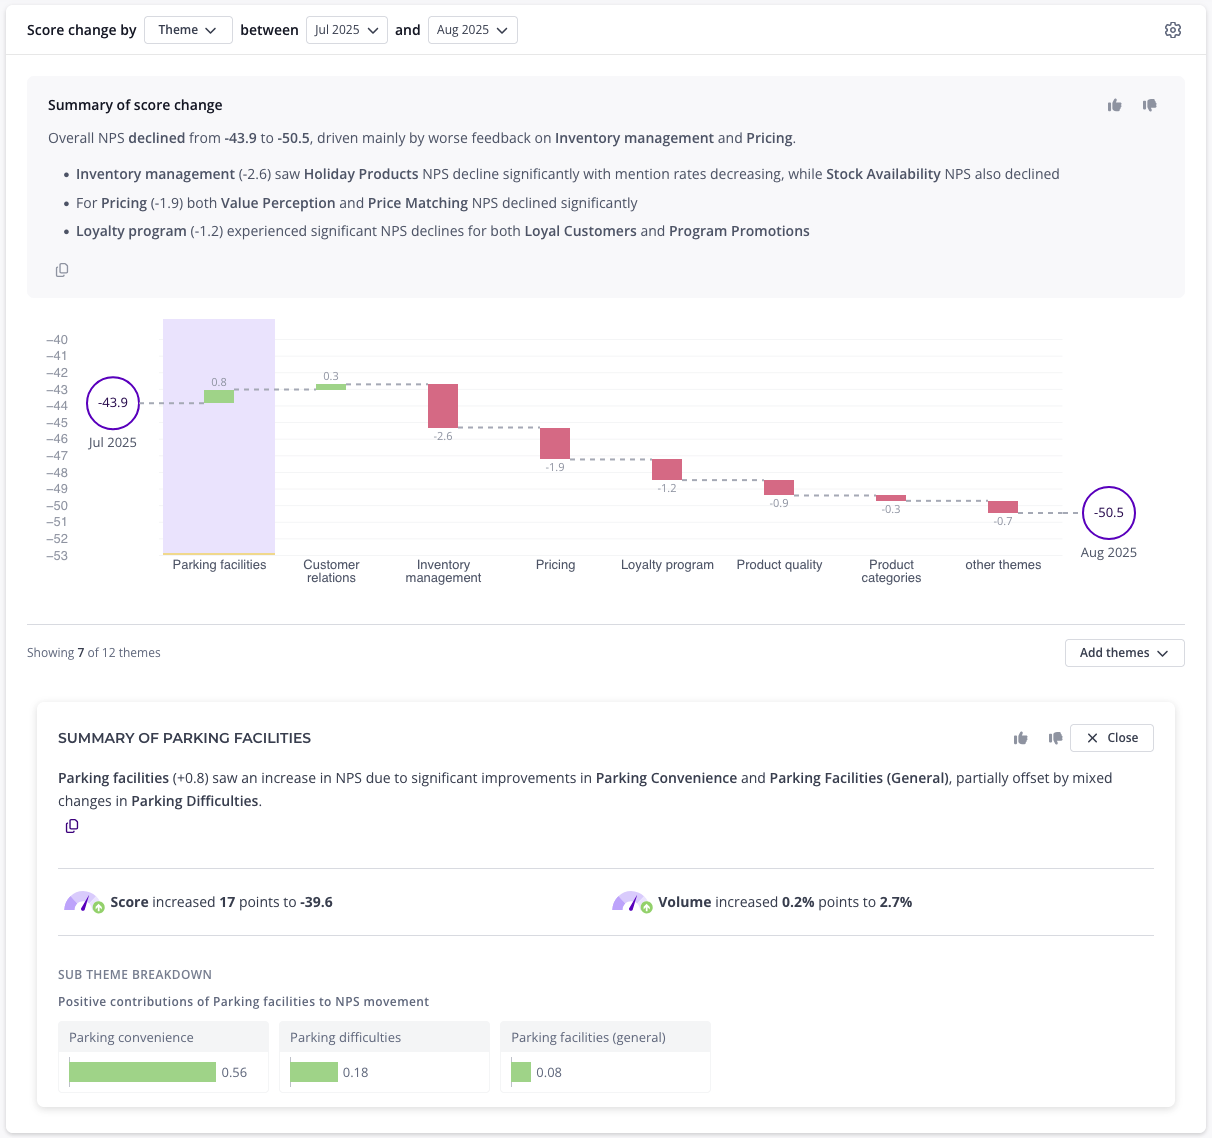
Segments that caused the change in score
- Use the dropdown above the graph to show the change by a filter instead of by theme, for example Region or Store. Themes are shown by default. In a lens you can also choose Data source.
- The dropdown lists the filters set up for your data. The score you’re viewing isn’t listed.
- Each bar shows how much a segment contributed to the change in score. A segment can move the score because its own score changed, or because it made up a bigger or smaller share of responses than before.
- Responses with no value for the filter are grouped into a No value bar, so the bars still add up to the total difference in score.
- The graph shows 7 bars by default, and the rest are grouped into Other. You can show more bars, or search for a segment to add it to the graph.
- Hovering over a segment shows its volume and score in both time periods.
- Click a segment to see a summary of what changed, how its score and volume changed, and which themes drove the change within it. The comments are limited to that segment. Click a theme or sub-theme to see it within that segment.
- This isn’t available for goodwill scores.
Other helpful articles
Was this article helpful?
Your feedback helps us improve our documentation.