
Revenue at Risk
Revenue at Risk is available on lenses only.
Revenue at Risk puts an estimated dollar value on every theme in your feedback, so you can rank themes by financial impact rather than by how often they are mentioned.
It is a real score type, not a separate tool. Once a lens admin has configured it, it appears in the score dropdown alongside NPS, CSAT or any other score, and the themes bar graph re-ranks by dollars.


Revenue at Risk is an estimate. It is built from the people who answered your survey and scaled up to your whole customer base, using churn rates and customer values that you supply. The goal is a defensible figure you can stand behind in a conversation, not an exact accounting number.
How the score is calculated
You configure three inputs: how likely each group of customers is to churn, what a customer is worth, and how many customers your business has in total. Thematic then works in three steps.
| Step | What happens |
|---|---|
| Per response | Customer value (from its cohort) × churn likelihood. A response worth $2,000 at a 20% churn likelihood contributes $400. |
| Per theme | Every at-risk response tagged with that theme is added up, then scaled from your survey respondents to your full customer base. |
| Total | The same sum, but each response is counted only once, no matter how many themes it is tagged with. |
Setting up Revenue at Risk
-
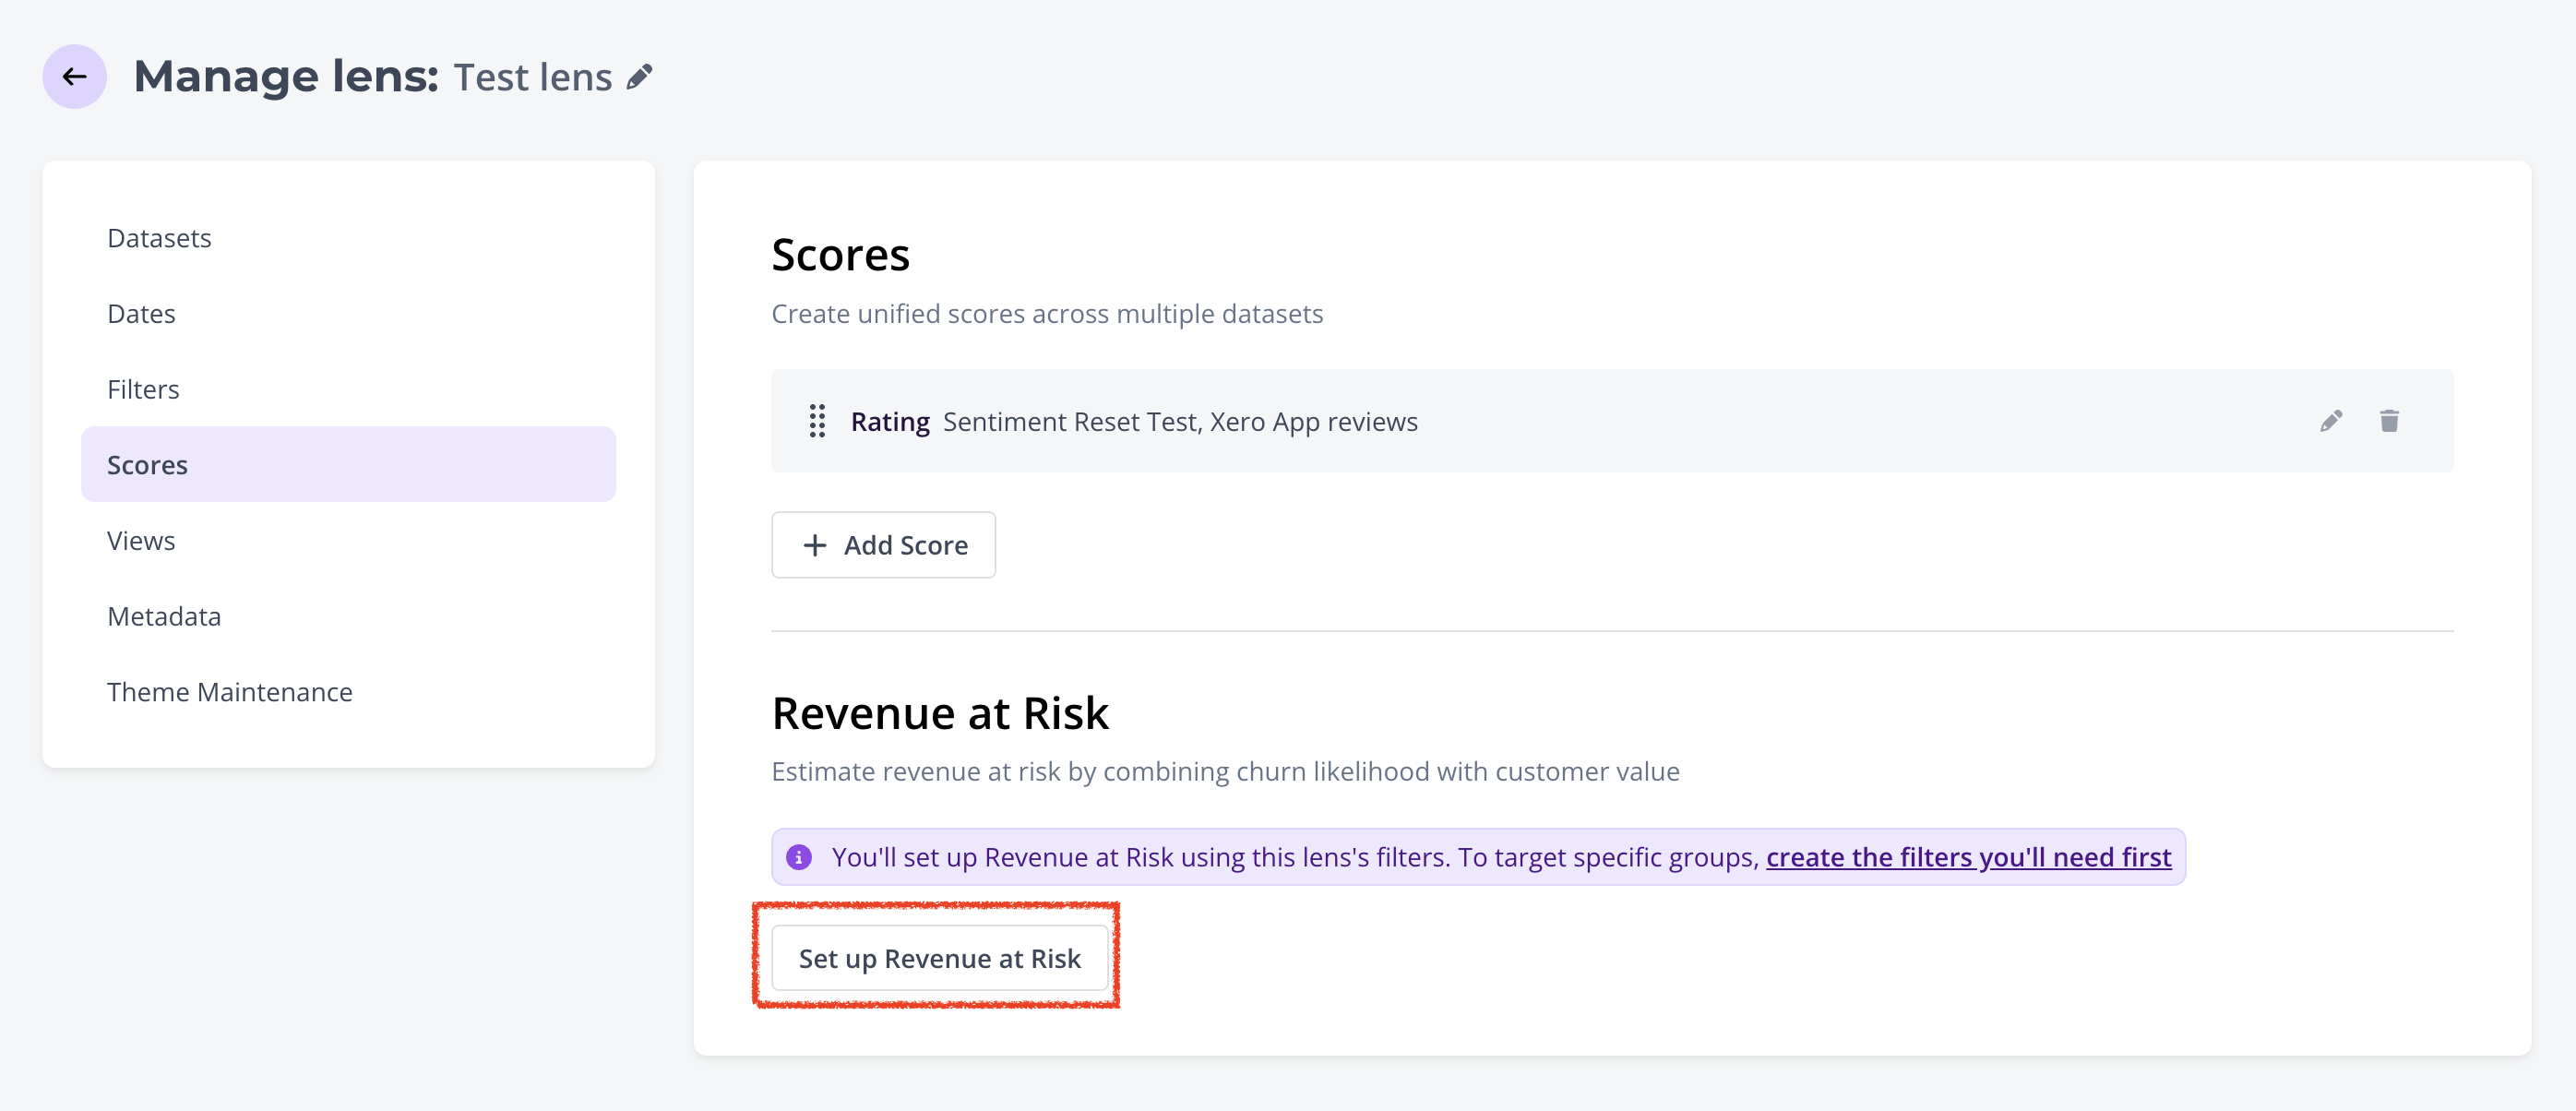
Go to Manage Lenses > Configure Lens > Scores and select Set up Revenue at Risk.
-
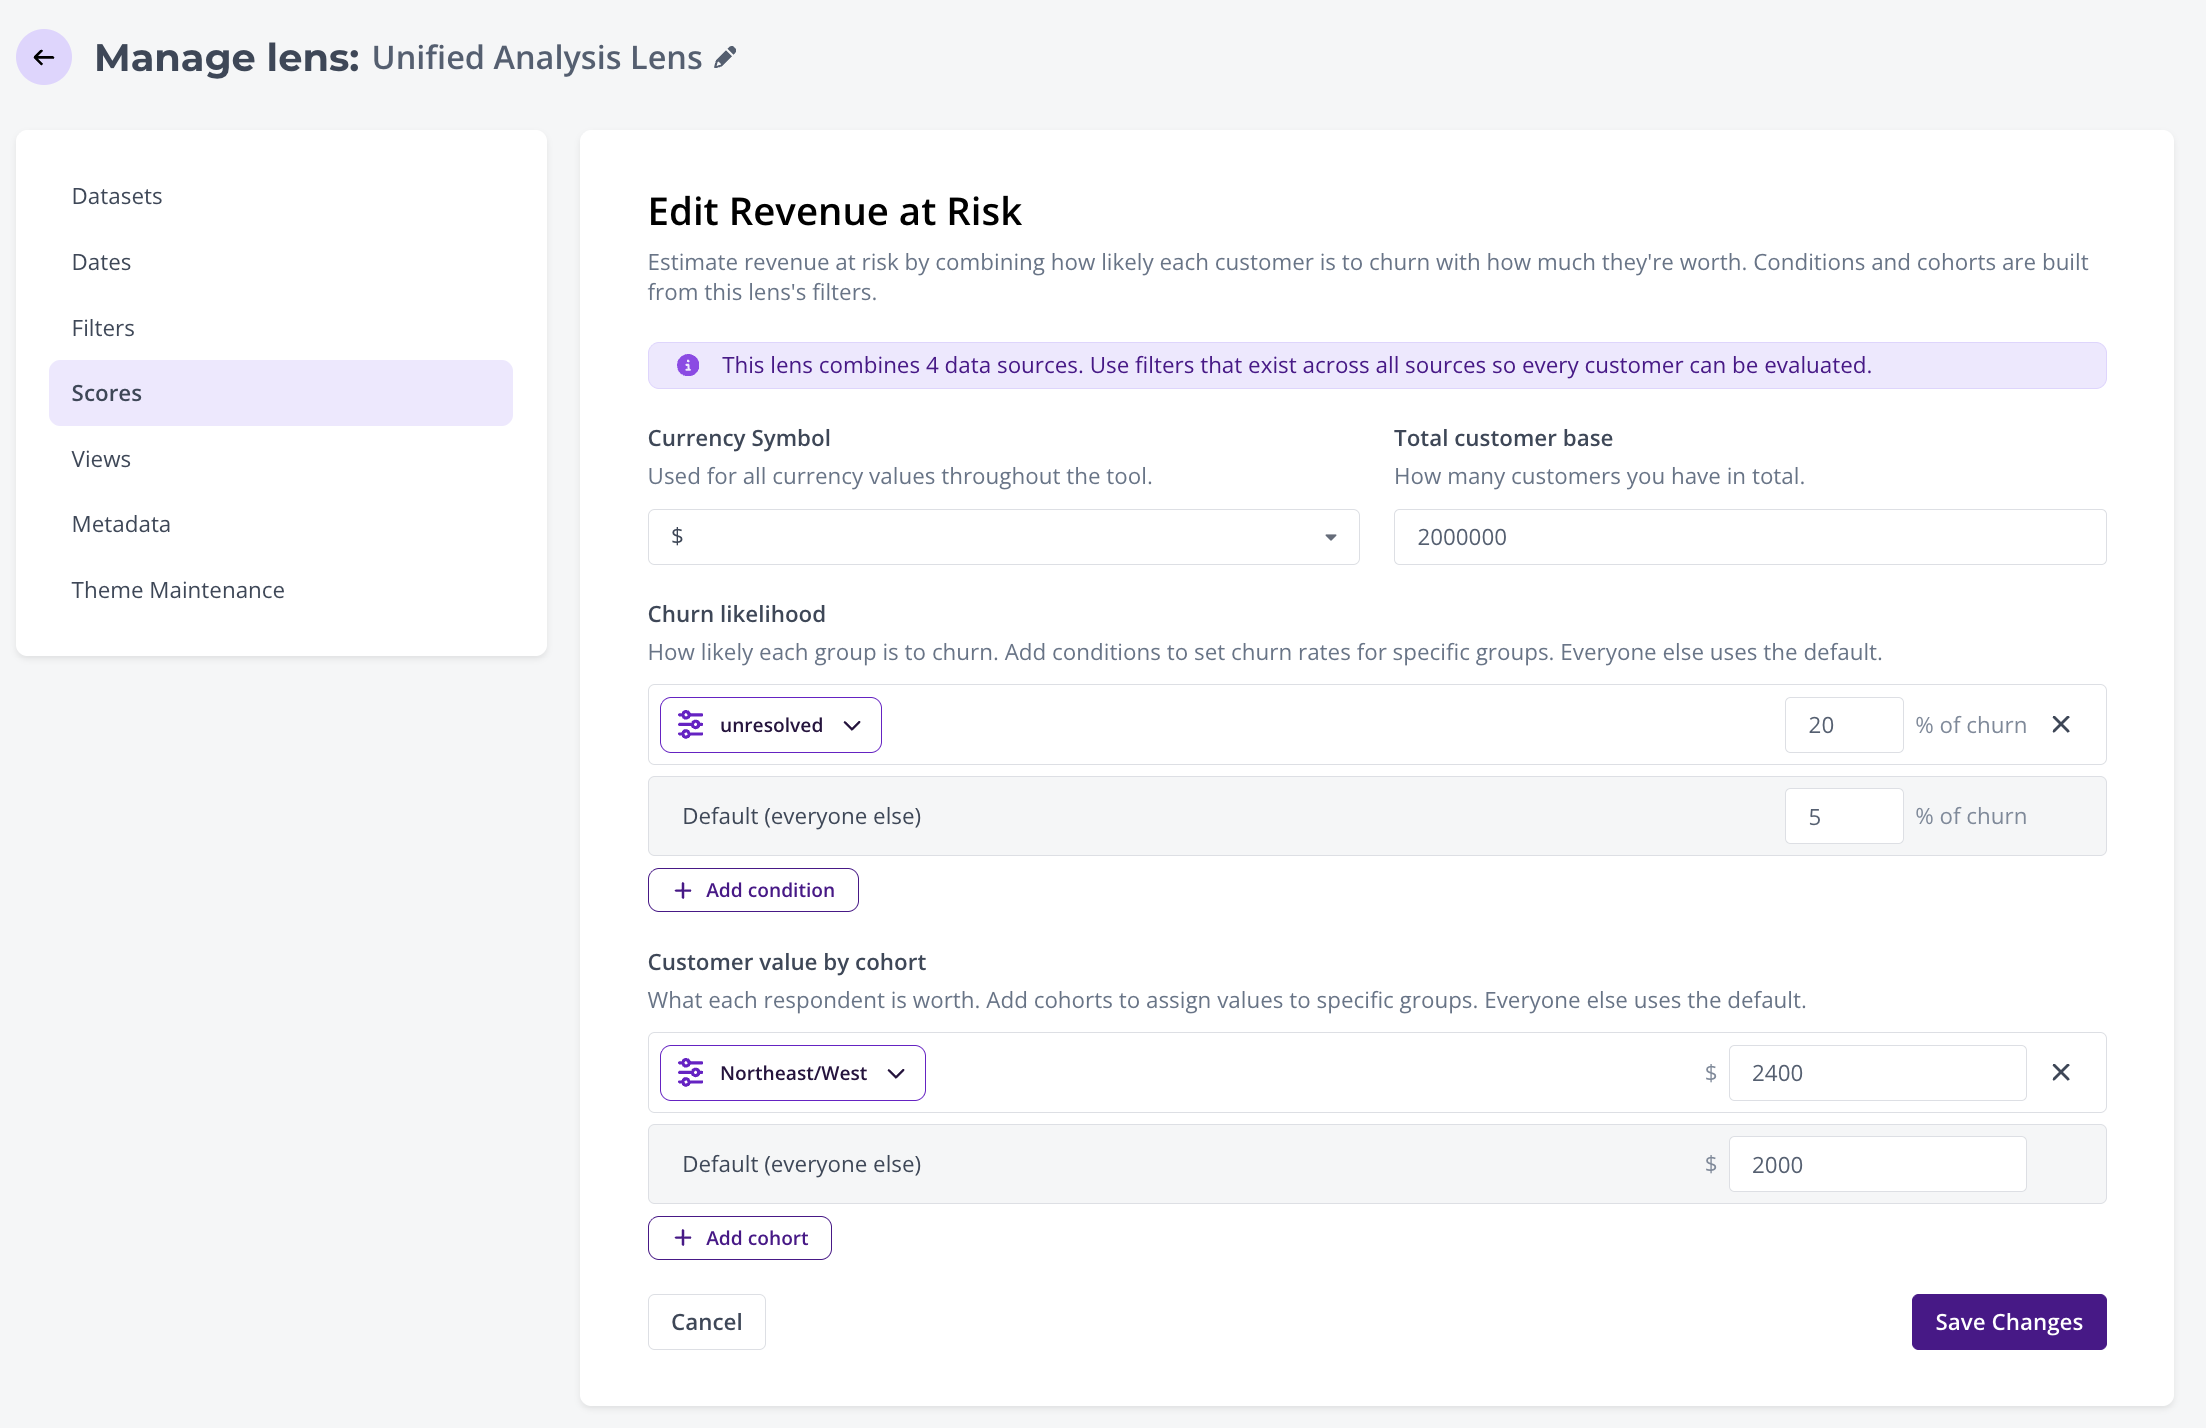
Populate the four fields described below: currency symbol, total customer base, churn likelihood and customer value.
Total customer base
The number of customers in your business — not the number of survey responses.
Survey responses only ever cover a fraction of a customer base. A business with 2 million customers might have 1,000 responses in a lens. This field is what lets Thematic scale the result up, so the figure reads as revenue at risk across your whole business rather than across the people who happened to answer.
- Scale factor = total customer base ÷ respondents in the current view.
- The denominator uses the filters and timeframe applied to the view, so the scale factor moves with the view.
- Most businesses take this number from finance or their CRM.
Churn likelihood
How likely someone is to actually leave. Not every detractor churns, so this is what keeps the figure an expected revenue at risk rather than a worst case.
- Add a condition using your lens filters and give it a percentage. For example, responses where a support ticket is still unresolved might be set at 20%.
- A default rate covers everyone who doesn't match a condition. This is the baseline churn you expect for reasons outside your control, such as a customer moving somewhere you don't operate.
- If a response matches two conditions, the highest percentage wins.
- The percentage discounts the value rather than filtering the response out. 20% of a $2,000 customer is $400 at risk.
- Because the default rate applies to every response, at-risk respondents will equal total respondents whenever the default is above 0%. This is expected. If you only want responses matching a condition to count, set the default to 0%.
These percentages are yours to decide, based on your own retention data.
Customer value
What one customer is worth to your business. This is deliberately flexible — lifetime value, annual contract value, average annual spend, or whatever your business already uses. Pick one basis and stay consistent.
- The default value applies to every customer.
- Add Cohort sets a different value for a group, defined with your lens filters. If you know customers in some regions spend more, you can give those regions a higher value.
- If a response matches two cohorts, the highest value wins.
- Responses matching no cohort use the default value.
Churn conditions and value cohorts are separate. One decides how likely a group is to leave, the other decides what that group is worth. Both are built from the same lens filters, but they don't have to use the same groupings.
Currency symbol
Display only. Picking $, £ or € changes the prefix character and nothing else — there is no conversion and no exchange rate applied.
Where you can use it
Anywhere a score works. Because Revenue at Risk is a real score type, it is available in:
- The Analysis tools
- Dashboards
- Answers
- The Thematic MCP server, where it becomes available automatically like any other score
Reading the numbers
Per-theme figures are a ranking signal, not a recovery estimate
If a theme shows $40M of revenue at risk, fixing that theme does not recover $40M. Someone unhappy about two things is still at risk when you fix only one of them, so their full value counts toward both themes. This is also why the theme bars add up to more than the total.
Use the per-theme number to decide what to work on first, not to forecast a return.
Impact and Score show the same values
This is expected. For a dollar figure, the score already is the impact.
Impact normally answers the question "this theme scores badly, but does it matter?" by adjusting for how many people mentioned it. Revenue at Risk is already a total in dollars, saying that this theme is putting this much at risk, so there is nothing further to adjust for.
It doesn't identify individual customers
Revenue at Risk is aggregated by theme. It is not customer churn prediction and it does not tell you which specific customers are at risk. You can click into a theme to read the verbatims contributing to it, the same as with any theme or score.
Lens weighting does not apply
Dataset weighting in a lens does not currently affect Revenue at Risk figures.
Related articles
- Editing your lens — where the lens configuration lives
- Understanding dataset weighting in a lens
- Best practices for using AI metrics and scores in Thematic
- Example scores or metrics
Was this article helpful?
Your feedback helps us improve our documentation.